THE PARTICLE QUANTIFIER
INDEX
The wear
readings traditionally encountered in oil analysis are expressed as a
percentage, or more commonly as PPM (parts per million) with 1 PPM being equal
to 1/10000th of 1% (eg. Fe = 100 PPM). These concentrations are
measured with a spectrometer, in Wearcheck’s case an ICP (Inductively Coupled
Plasma) spectrometer. There is a fundamental limitation to measuring the
concentration of wear debris with this technique. Because of the way that these
instruments work, particles greater than 8 - 10 m
(micron) cannot be detected. It is obvious that a critical wear situation could
exist with large particles present but the iron concentration might be low, i.e.
most of the wear particles are greater than 10 m in size
and would not be picked up by the spectrometer.
The
solution to this problem would be to filter all the oil samples through a 10
m
membrane and examine any debris present with a microscope. This practice is
highly labour intensive as it cannot be automated, both in terms of preparing
the membrane and having someone look through hundreds of debris pads, as they
are called, every day (roughly 1300 per day at Wearcheck). In order to keep
costs and turn around time to a minimum without sacrificing quality, the PQ is
used.
The PQI
(Particle Quantifier Index) is a bulk magnetic index of the oil sample. The oil
sample is shaken and then placed in an instrument that uses a magnetic field
which is disturbed by any ferrous (magnetic) material in the sample,
irrespective of size. The extent to which the magnetic field is disturbed is
proportional to the total ferromagnetic content of the oil. The PQ is a unitless
number but it is quantitative and can be trended. The higher the number, the
more ferrous debris present. If the PQ had units, they would be related to the
magnetic inductance of the sample, probably Webers per square centimetre.
Attempts have been made to correlate the index with an actual concentration
value such as milligrams of iron per litre of oil but, because different steels
have different magnetic inductances, this has met with limited
success.
Although
the PQ is a quantitative measurement, the laboratory uses it as a screening
test. If the PQ is over a certain failure limit, the oil is filtered through a 5
m
membrane (pad) and any debris present is examined under a microscope. A
qualitative description of the debris is given in the diagnosis.
The
failure limits depend on the type of component from which the oil has come. As
an example, a hydraulic system runs far more delicately and cleanly than a
conveyor gearbox and what is acceptable for the gearbox would indicate
catastrophic wear in the hydraulic system. The failure PQ for the hydraulic
system is 25, for the gearbox 230. These failure limits have been determined
from correlation studies of tens of thousands of samples where both a PQ and an
MPE (Microscopic Particle Examination) have been carried out. The PQ of every
oil sample is measured at Wearcheck and approximately 20% of the samples fail
the screening test. Of these 20%, roughly half of the MPE’s carried out show no
abnormal wear debris; this shows that the screening limits are kept very
tight.
Although
the laboratory uses the PQ as a screening test, the diagnostics department looks
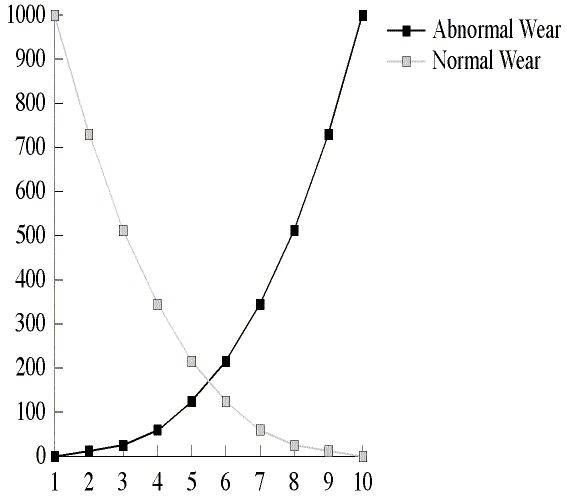
at it in a quantitative manner. A normal wear profile (see Graph 1) should
show a large number of small wear particles and few large ones. As abnormal wear
starts to take place, this profile will shift to a greater number of larger wear
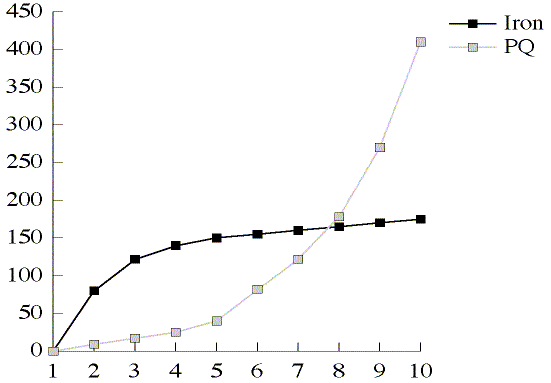
particles. It is possible for the iron reading to level out or even decrease,
because of the size limitation and filtration, whilst the PQ starts to increase
in an abnormal wear situation (see Graph
2).
|
|
|
|
Graph 1 |
Graph 2 |
In the
case of non-magnetic wear material such as white metal, aluminium or
copper/brass/bronze, it is very unusual to find a non-ferrous metal wearing
against another non-ferrous metal. Iron and steel tend to be the major wearing
elements in all mechanical systems. Often, non-magnetic material becomes
impacted with the ferrous wear debris during the wear process so even
non-magnetic material is detected by the PQ.
Another
debris detection technique is particle counting, commonly known as the ISO 4406.
All tests carried out in the laboratory are concerned with measuring the
concentration of a known entity, eg. how much water or iron is present, or the
viscosity of the oil. Particle counting, however, looks at 'how many' and 'how
big' without concerning itself with what the particles are actually made of.
They could be anything: iron, copper, dust or, in Kwazulu-Natal, wood chips and
sugar cane. In effect, the particle count gives a measure of the cleanliness of
the oil.
Particle
counting is only carried out on what are traditionally called clean oil systems:
hydraulics, pumps, compressors, turbines and automatic transmissions. These are
the systems that are sensitive to particulate contamination. Depending on which
body of research is read, 70 to 85% of all hydraulic system failures are due to
particulate contamination, with 90% of these failures being due to abrasive
wear.
This
test has become so important that certain OEM’s (Original Equipment
Manufacturers) have set upper limits on the cleanliness levels for the oils used
in their hydraulic systems, insisting that the oil be monitored on a regular
basis. If a failure occurs and the particle count is too high, this might be grounds for the rejection
of a warranty claim. Unfortunately, getting these limits out of most OEM’s can
be difficult, if not impossible. Wearcheck is often asked what an acceptable
contamination level is, but this can only be determined by the manufacturer of
the equipment.
Although
the concept of particle counting is straightforward, the mechanics of carrying
out the test are fraught with controversy, so much so, that the ISO
(International Standards Organisation) has had the whole procedure under review
for most of this decade. Let’s examine where these problems arise and how they
may be resolved.
Different
methods
There
are two basic methods for carrying out a particle count on an oil sample: manual
and automatic. In this day and age of high production requirements, manual
counting methods have fallen into disuse as they are very time consuming and
prone to human error. With this technique, the oil is filtered through a
membrane of known pore size, the
particles are counted manually under a microscope over a small area and the
results extrapolated for the whole sample.
Automatic
particle counters have been around since the early 1960’s and fall into two main
sub-divisions, light blockage and filter blockage techniques. In the light blockage technique, a small
sample of the oil is passed between a laser light source and a detector, and the
shadows cast by the particles on the detector are measured. The signals sent by
the detector are processed through a sophisticated mathematical modelling
programme and result in a number of particle counts per millilitre of oil in
various size ranges. With the filter
blockage method, a larger volume of oil is passed through a mesh of known
pore size and the time taken for the mesh to block is measured. The particle
count is then determined from a standard size distribution profile.
Different
calibrations
The two
instruments used in automatic particle counting have to be calibrated and there
are two ways of doing this. Both methods use an oil that has particles dispersed
in it of a very accurately known particle size distribution. One method uses
latex spheres - because of their spherical symmetry, it does not matter what
orientation they take when they are presented to the laser detector or flow
through the mesh. The objection to this calibration technique is that particles
in the real world are not all perfectly spherical. The other method of
calibration is to use ACFTD (Air Cleaner Fine Test Dust). This is dust that is
actually swept out of the Mojave Desert in the United States, but has a very
consistent size distribution profile. The argument against this calibration
method is that particle orientation now becomes important.
So, we
now have three methods of particle counting and two methods of calibrating the
instruments, resulting in five possible ways of determining oil cleanliness
(manual counting is absolute and is not calibrated as such). All well and good -
it is nice to have so many options - but problems arise because all five
techniques will give different results, not radically so, but enough to cause
confusion. Furthermore there is no direct correlation between the methods.
At this
point in time all combinations are used and accepted which is fine as long as
only one laboratory is used (good repeatability) and a trend can be established.
However, when other laboratories come into the picture (poor reproducibility),
different combinations of methods may be used and then discrepancies will occur.
Neither system is entirely wrong, neither system is entirely right. Wearcheck
uses the light blockage instrument calibrated with ACFTD which is the preferred,
but not officially sanctioned, method.
There
are as many pros as cons for whichever combination is selected. The method
Wearcheck uses has the advantages of using real world particles for calibration
and an instrument that measures actual size ranges rather than assuming a
typical distribution profile. The disadvantages are that particle orientation
becomes important and heavily coloured oils cannot be analysed accurately,
neither can oils contaminated with water (the detector sees water droplets as
particles).
The ISO
has finally standardised a calibration method for automatic particle counters
(under ISO 11171, also called ISO
MTD for Medium Test Dust). This standard is also traceable which means that it
is suitable for laboratories operating under a quality management system such as
ISO 9000. This, however, is not the end of the story.
Many
people are familiar with the term ISO 4406 for a particle count. The procedure
laid down under ISO 4406 gives an easily understandable method for expressing
fluid cleanliness. Wearcheck measures the total number of particles per
millilitre of oil in eight size ranges: 5-10 micron, 10-15 micron, 15-20 micron,
20-25 micron, 25-50 micron, 50-75 micron, 75-100 micron and greater than 100
micron (1 micron = 1/1000th of a millimetre).
For
most oils these numbers are frighteningly large and it can be very difficult to
determine how much cleaner or dirtier one oil may be from another. What ISO 4406
does is to count all particles
greater than 5 m and
assign a range number to that value, then count all particles greater than 15
m and
assign another range number. So instead of looking at eight different and
difficult to comprehend numbers, ISO 4406 gives a cleanliness index of two
numbers such as 18/15 that would be dirtier than 17/13 for example. This system
is much easier to understand.
The table below, shows how these numbers are determined. A common misconception about these range numbers is that the first number only counts the number of particles between 5 and 15 m when in actual fact it counts all the particles greater than 5 m. These two ranges have been chosen because the first number gives a general silting index of the oil and the second number is more indicative of abnormal wear and/or contamination.
| Number of particles per ml |
| More than | Up to and including | Scale Number |
| 80 000 | 160 000 | 24 |
| 40 000 | 80 000 | 23 |
| 20 000 | 40 000 | 22 |
| 10 000 | 20 000 | 21 |
| 5 000 | 10 000 | 20 |
| 2 500 | 5 000 | 19 |
| 1 300 | 2 500 | 18 |
| 640 | 1 300 | 17 |
| 320 | 640 | 16 |
| 160 | 320 | 15 |
| 80 | 160 | 14 |
| 40 | 80 | 13 |
| 20 | 40 | 12 |
| 10 | 20 | 11 |
| 5 | 10 | 10 |
| 2.5 | 5 | 9 |
| 1.3 | 2.5 | 8 |
| 0.64 | 1.3 | 7 |
| 0.32 | 0.64 | 6 |
| 0.16 | 0.32 | 5 |
| 0.08 | 0.16 | 4 |
| 0.04 | 0.08 | 3 |
| 0.02 | 0.04 | 2 |
| 0.01 | 0.02 | 1 |
| 0.005 | 0.01 | 0 |
| 0.0025 | 0.005 | 0.9 |
Allocation of Scale Numbers
Some
cleanliness measurements give a three number index, eg. 20/17/14 where the first
number indicates all particles
greater than 2 m. Up
until now this has never been officially sanctioned by the ISO and recent
research has shown that most automated particle counters are not sensitive
enough to provide accurate particle counts at such a small size.
Problems
arise because there is no direct or linear correlation between calibration with
ACFTD and MTD. The reasons for this are quite complex but the differences
between the two systems are shown in the table below.
|
OLD
ACFTD |
NEW
MTD |
|
2m |
4m |
|
5m |
6m |
|
15m |
14m |
This
will mean that the new calibration system will show fewer particles at the 2 and
5 m level
and more particles at the 15 m level.
The differences are slight but are
once again non-linear and, when the new calibration method comes into effect,
trends will appear to change slightly. This, however, will result in better
resolution of the test.
The
Wearcheck report gives a two number cleanliness ratio, measuring particles
greater than 5 and 15 m (the 2
m is not
measured) but does not call it an ISO 4406, and there is a very good reason for
this. ISO 4406 only governs how the numbers are assigned while other ISO
documents, such as ISO 4402 and 4572, make up a very complex procedure which
governs how the bottles are produced (only glass can be used), how the sample is
taken, and the number of times the test must be done in the laboratory. The
sampling procedure is beyond the capabilities of most workshops and the
production and quality control of the sampling bottle as well as the analytical
technique in the laboratory would push the price of the test beyond the budget
of most people.
The
service that Wearcheck provides is affordable and in most cases will give the
same answer as an official ISO 4406 but, because not all the procedures are
strictly adhered to, it would not be technically correct to call the numbers
quoted an ISO 4406 cleanliness rating. The procedure that Wearcheck uses is
'based upon but not conforming to' ISO documentation, a wonderful phrase that
allows strict quality control for situations adapted to local conditions and
needs.
Another
technique in Wearcheck’s arsenal of tests is RPD (Rotary Particle Deposition)
ferrography, which is supplementary to the normal tests carried out in the
laboratory. An oil sample from a stationary industrial gearbox that goes through
the standard battery of tests may show a high iron concentration and a high PQ,
and the MPE (Microscopic Particle Examination) may show excessive visible debris
under the microscope indicating a severe wear situation. All of this can be
taken one level deeper with RPD ferrography which involves the removal of
ferrous debris from the oil.
This
debris is deposited on a small, square, glass slide that rotates in a magnetic
field. The debris is separated by the magnetic field and flow decay into three
distinct bands based on particle size. Once the slide has been dried, it can be
examined under a powerful compound microscope with the ability to resolve debris
down to 1 m in size
(the typical width of a human hair is about 40 m). Using
special lenses, filters and lighting techniques, the morphology of individual
wear particles can be determined.
Size and
concentration are still important but properties such as surface texture, edge
and outline detail and colour can be examined. This leads to the identification
of various wear modes such as cutting, sliding, rolling and rubbing wear, all of
which have different causes. It also means that it is possible to distinguish
between such things as gear and bearing wear as the two types of particles
appear very different when examined on an individual basis.
The PQ,
MPE, particle count and RPD ferrography make up the techniques employed when oil
analysts refer to debris analysis. They cover a wide range of situations that
would not have been identified by traditional spectrometric analysis, a
technique that has been in use for more than 50 years. As with many other
disciplines, technological advances are being made all the time in the field of
oil analysis.
John Evans is diagnostic manager - mobile equipment of the Wearcheck Division of Set Point Technology.
Publications are welcome to reproduce this article or extracts from it, providing the Wearcheck Division of Set Point Technology is acknowledged.
Produced by the Wearcheck Division of Set Point Technology
Felicity Howden Public Relations 9/99
Get added to our
Techdata Mailing List.
(please include your name
and full address in the note)
These Technical Bulletins are published quarterly by Wearcheck Africa., and are circulated free to customers of Wearheck. To be added to our circulation list send us an e-mail with your name and full address.
©1997 Wearcheck Africa. Reproduction in full or in part is strictly forbidden without written permission of Wearcheck Africa.